p5, Shapes && Color
About p5.js
p5.js is an open source code editor for artist, designer, and beginner programmers. It is a JavaScript library adaptation of the open source project Processing developed by Casey Reas and Ben Fry in 2001. p5.was first developed by artist Lauren Lee McCarthy in 2013.
p5.js Editor
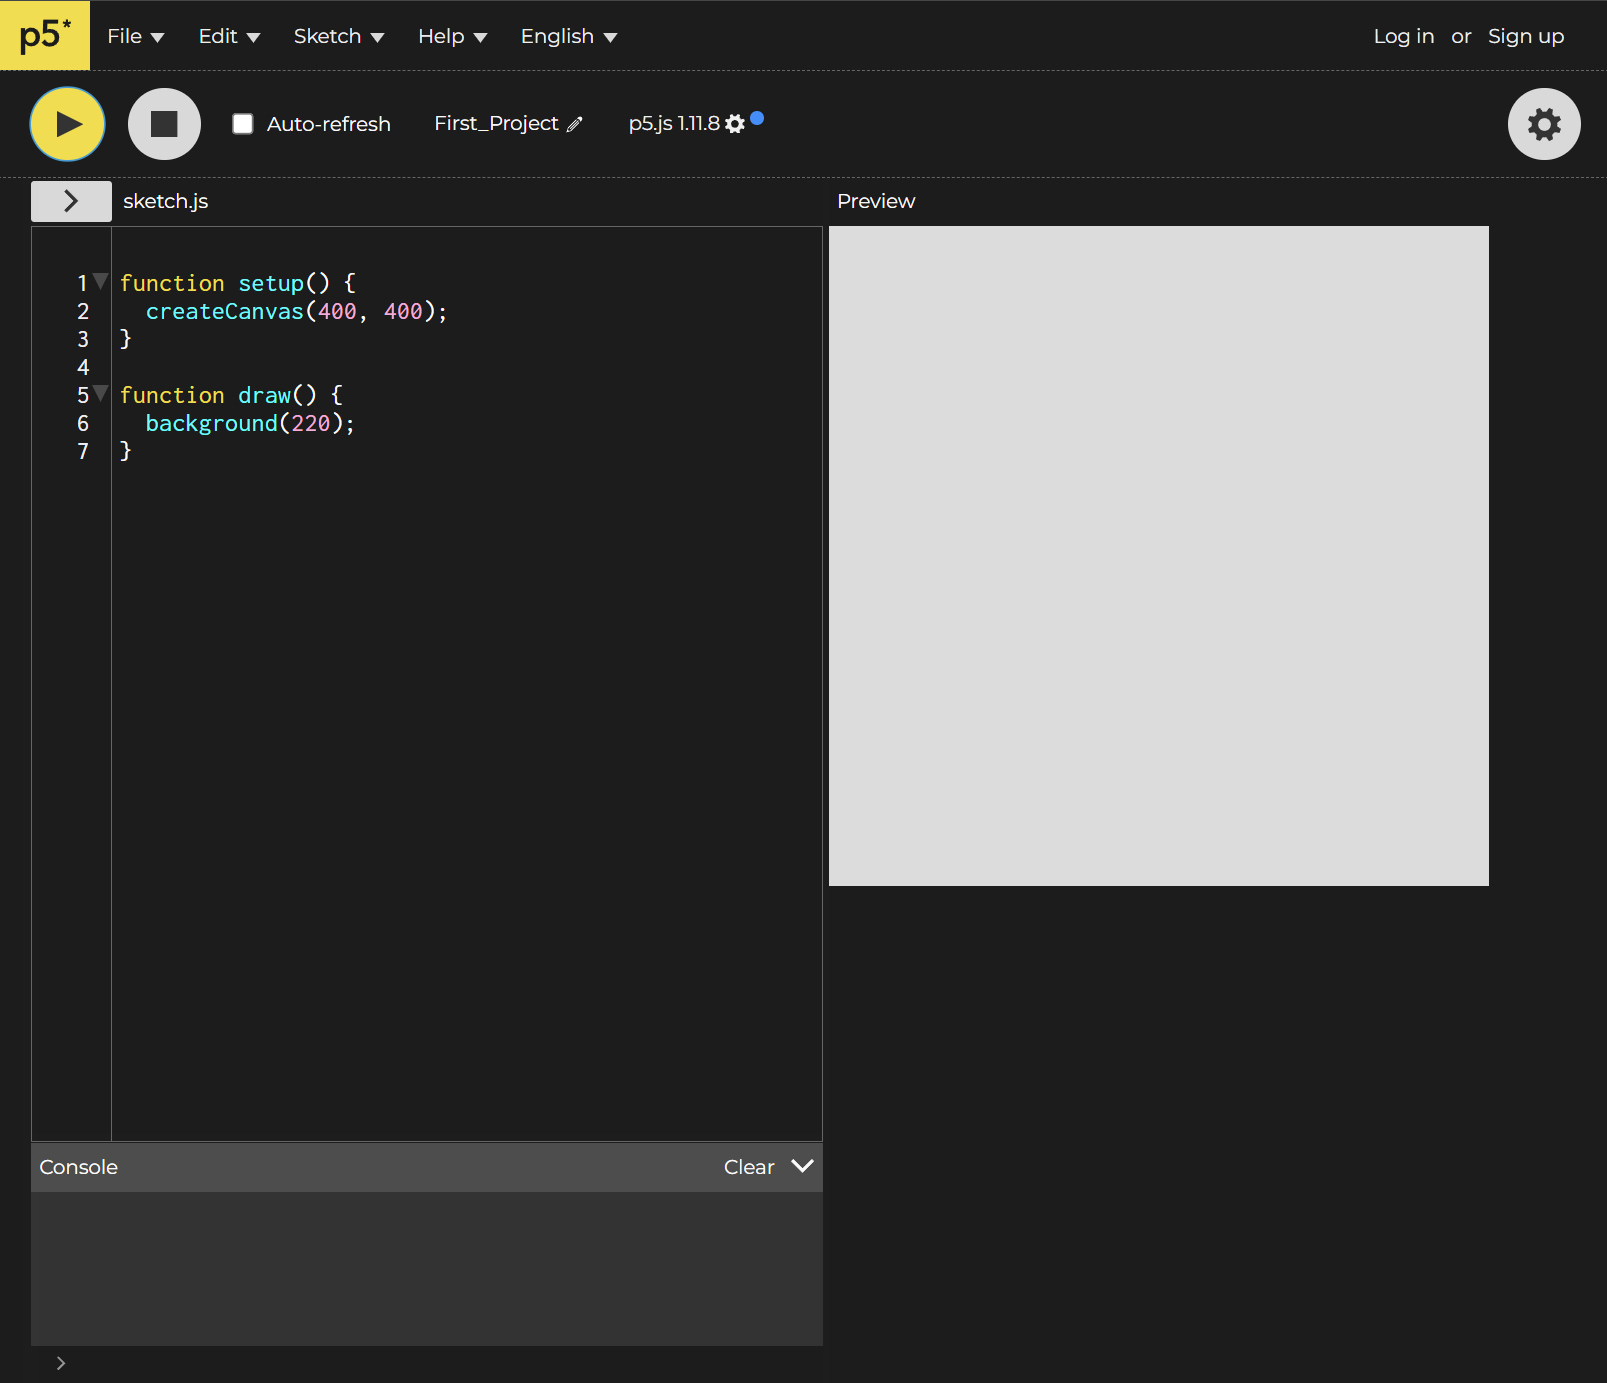
The interface of the p5 Editor is fairly simple:
- The area on the left is where we can write our instructions (also known as code) for our artworks.
- The play button at the top allows us to run our code.
- The stop button stops our code.
- The top menus allow us to access various options related to the p5 editor.
Customizing your p5 editor
You can change to High Contrast mode by clicking on the gear icon and going to General Settings.
You can also customize your Text Size for easier reading.
Saving and Renaming
You can save your sketch by pressing ctrl+s of navigating to file > save.
You can rename your sketch by clicking on your project name next to the pencil icon.
Calling Functions
Calling functions such as createCanvas(400,400); consists of 4 parts:
- Function name -
createCanvas - Open and closed parentheses -
() - Parameters - amount specific to each function -
createCanvas(400,400) - Semicolon - this tells p5.js to move to the next line of code -
;
createCanvas()
createCanvas() is a function that sets the size of our canvas.
Syntax: createCanvas(w, h)
Parameters
- w - width
- h - height
Syntax
Syntax is the word we use to describe the particular writing style of a programming language. Every programming language has a different syntax.
Comments
We can annotate our code by using comments. Comments are bits of text written in the editor that our computer ignores. We can start a comment by typing //.
Example:
function setup(){
    //Create a canvas that is 400 pixels for width and height
    createCanvas(400,400);
}
Errors
Computer languages are very specific about using the correct syntax. If our syntax is incorrect, we'll will receive an error.
Example:
If I spell 'createCanvas()' incorrectly, my sketch won't run, and p5 will let me know I have an error.

This error says "createCanva is not defined" , becuase the p5.js editor does not know what the function createCanva() is.
setup() and draw()
We'll get more into how setup() and draw() function in the next class. For now, we can think of setup() as where we set up our sketch by drawing our canvas, and draw() is where we can make our drawing. We want to make sure that our code is in between the { } of the function.
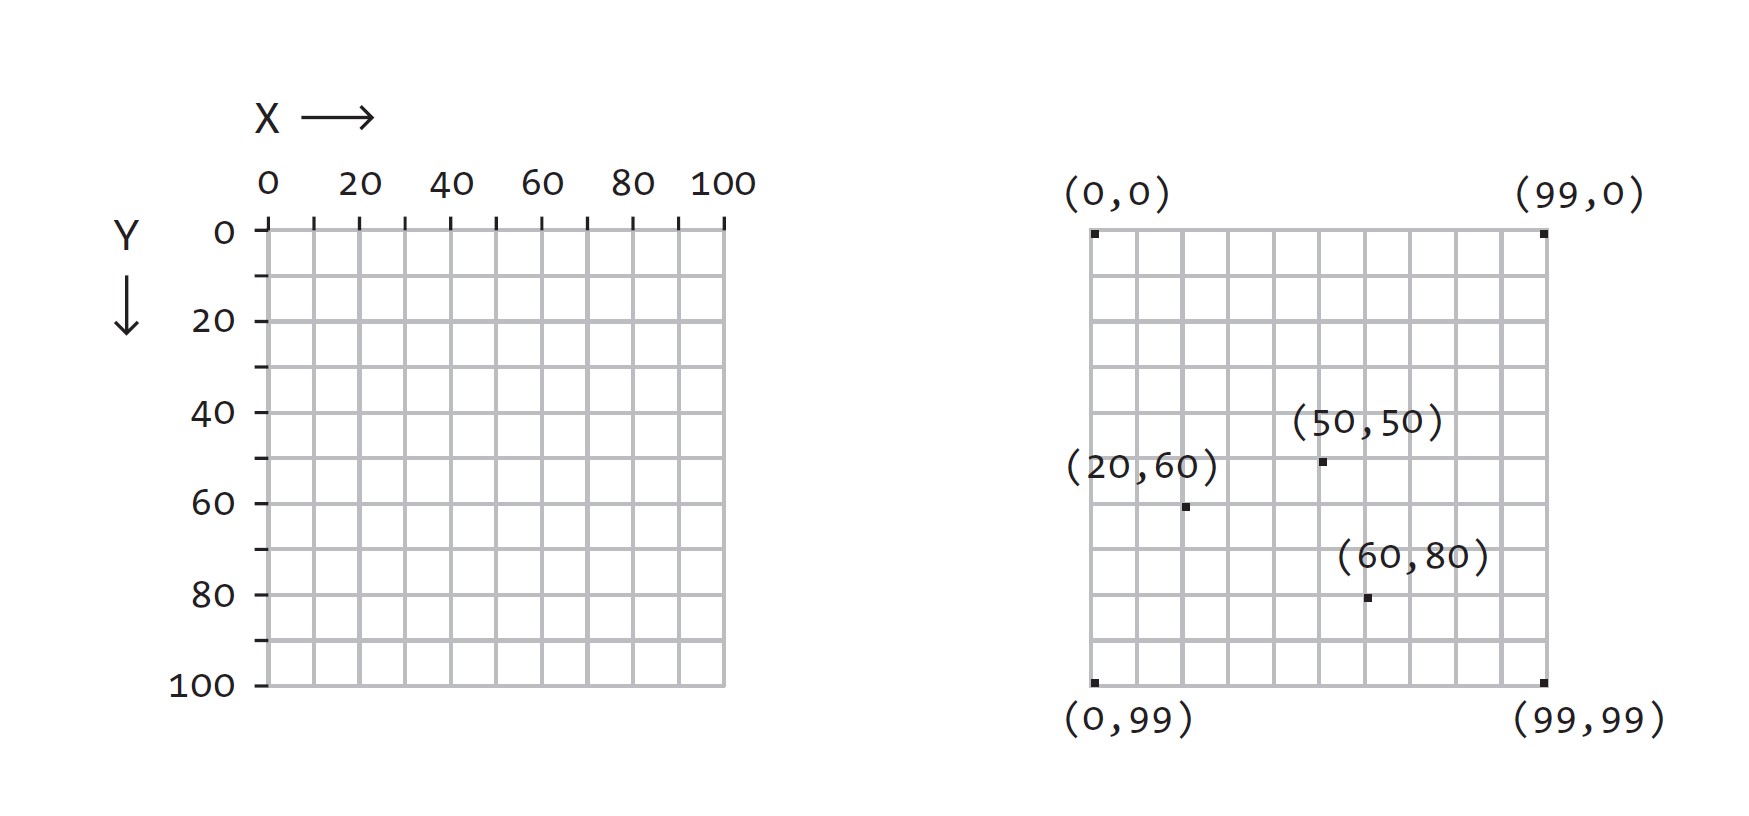
Coordinate System
Unlike a standard Cartesian coordinate system which might be familiar to you from previous studies in math, the origin, or (0,0) position of our canvas is not in the center. (0,0) is at the top left corner for our p5.js canvas.
Shapes
line()circle()rect()square()
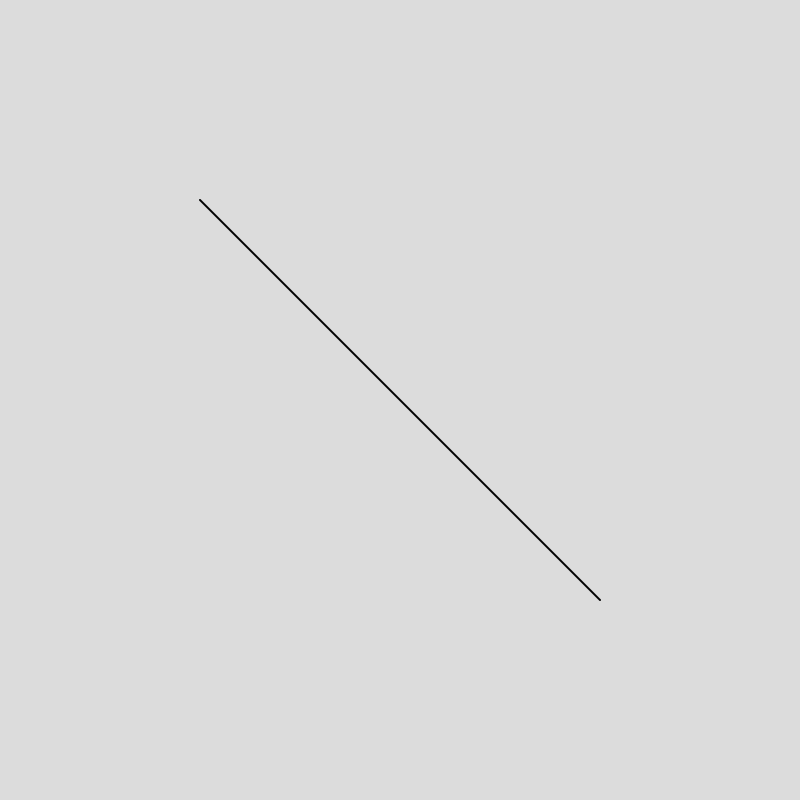
line()
line(x1, y1, x2, y2) is a function that draws a line to our canvas.
Example:
function setup(){
    createCanvas(400,400);
}
function draw(){
    background(220);
    line(100,100,300,300);
}
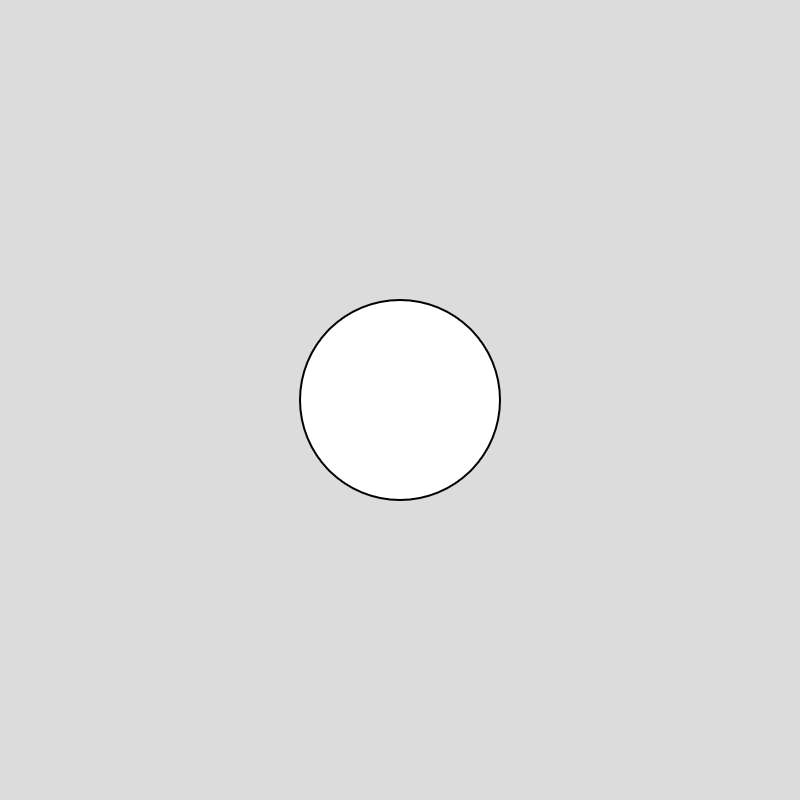
circle()
circle(x, y, diameter) is a function that draws a circle to our canvas.
Example:
rect()
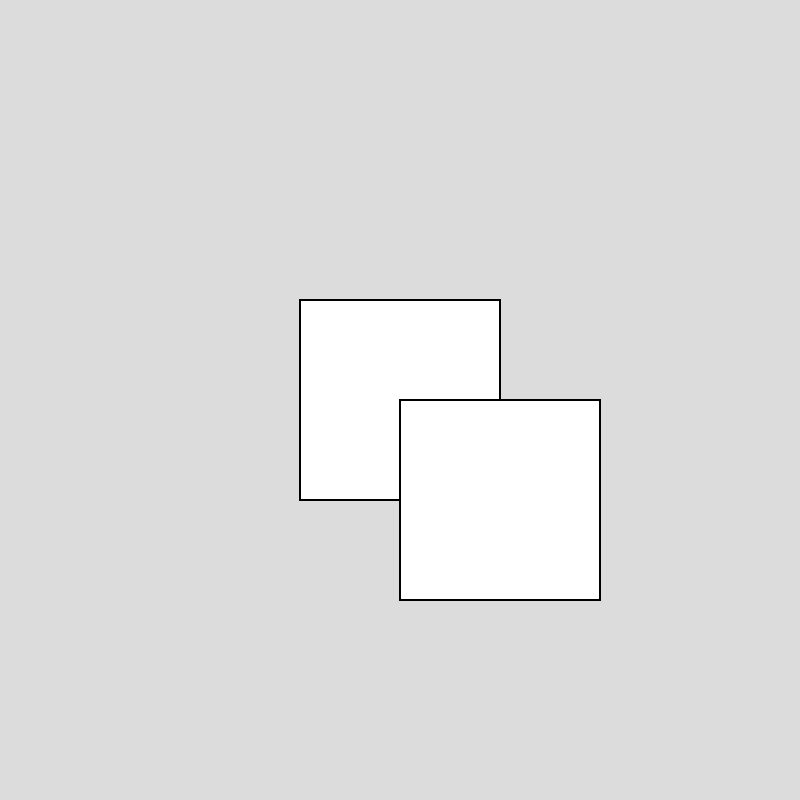
rect(x, y, w, h) draws a rectangle to our screen.
By default, the x and y position of our square is anchored to the upper left corner.
Example:

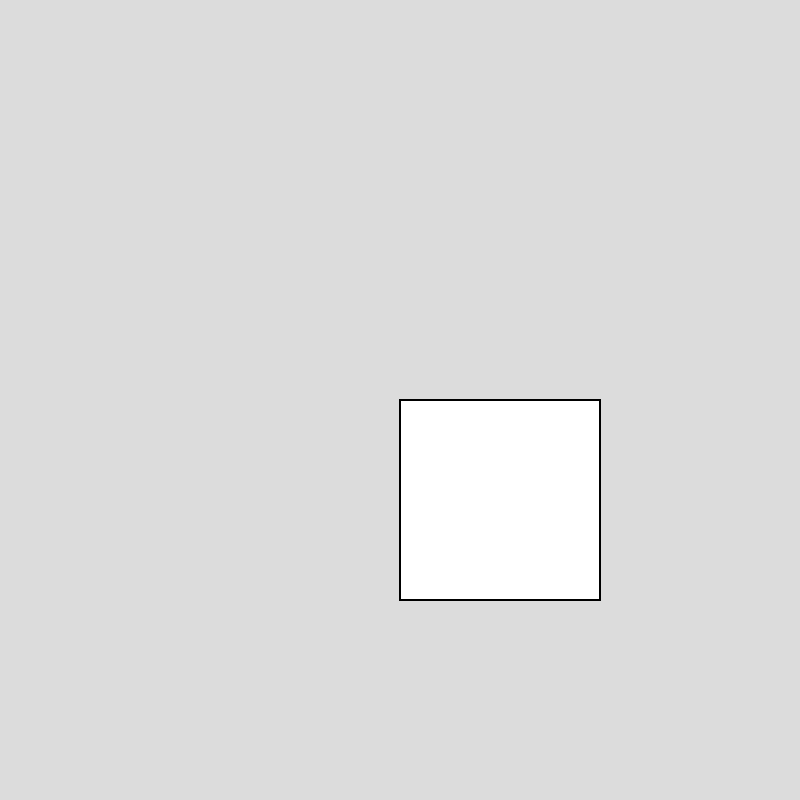
square()
For drawing a rectangle with equal sides, we can alternatively use the square() function:
Syntax: square(x, y, size)
Example:
function setup() {
  createCanvas(400, 400);
}

function draw() {
  background(220);
  square(200, 200, 100);
}
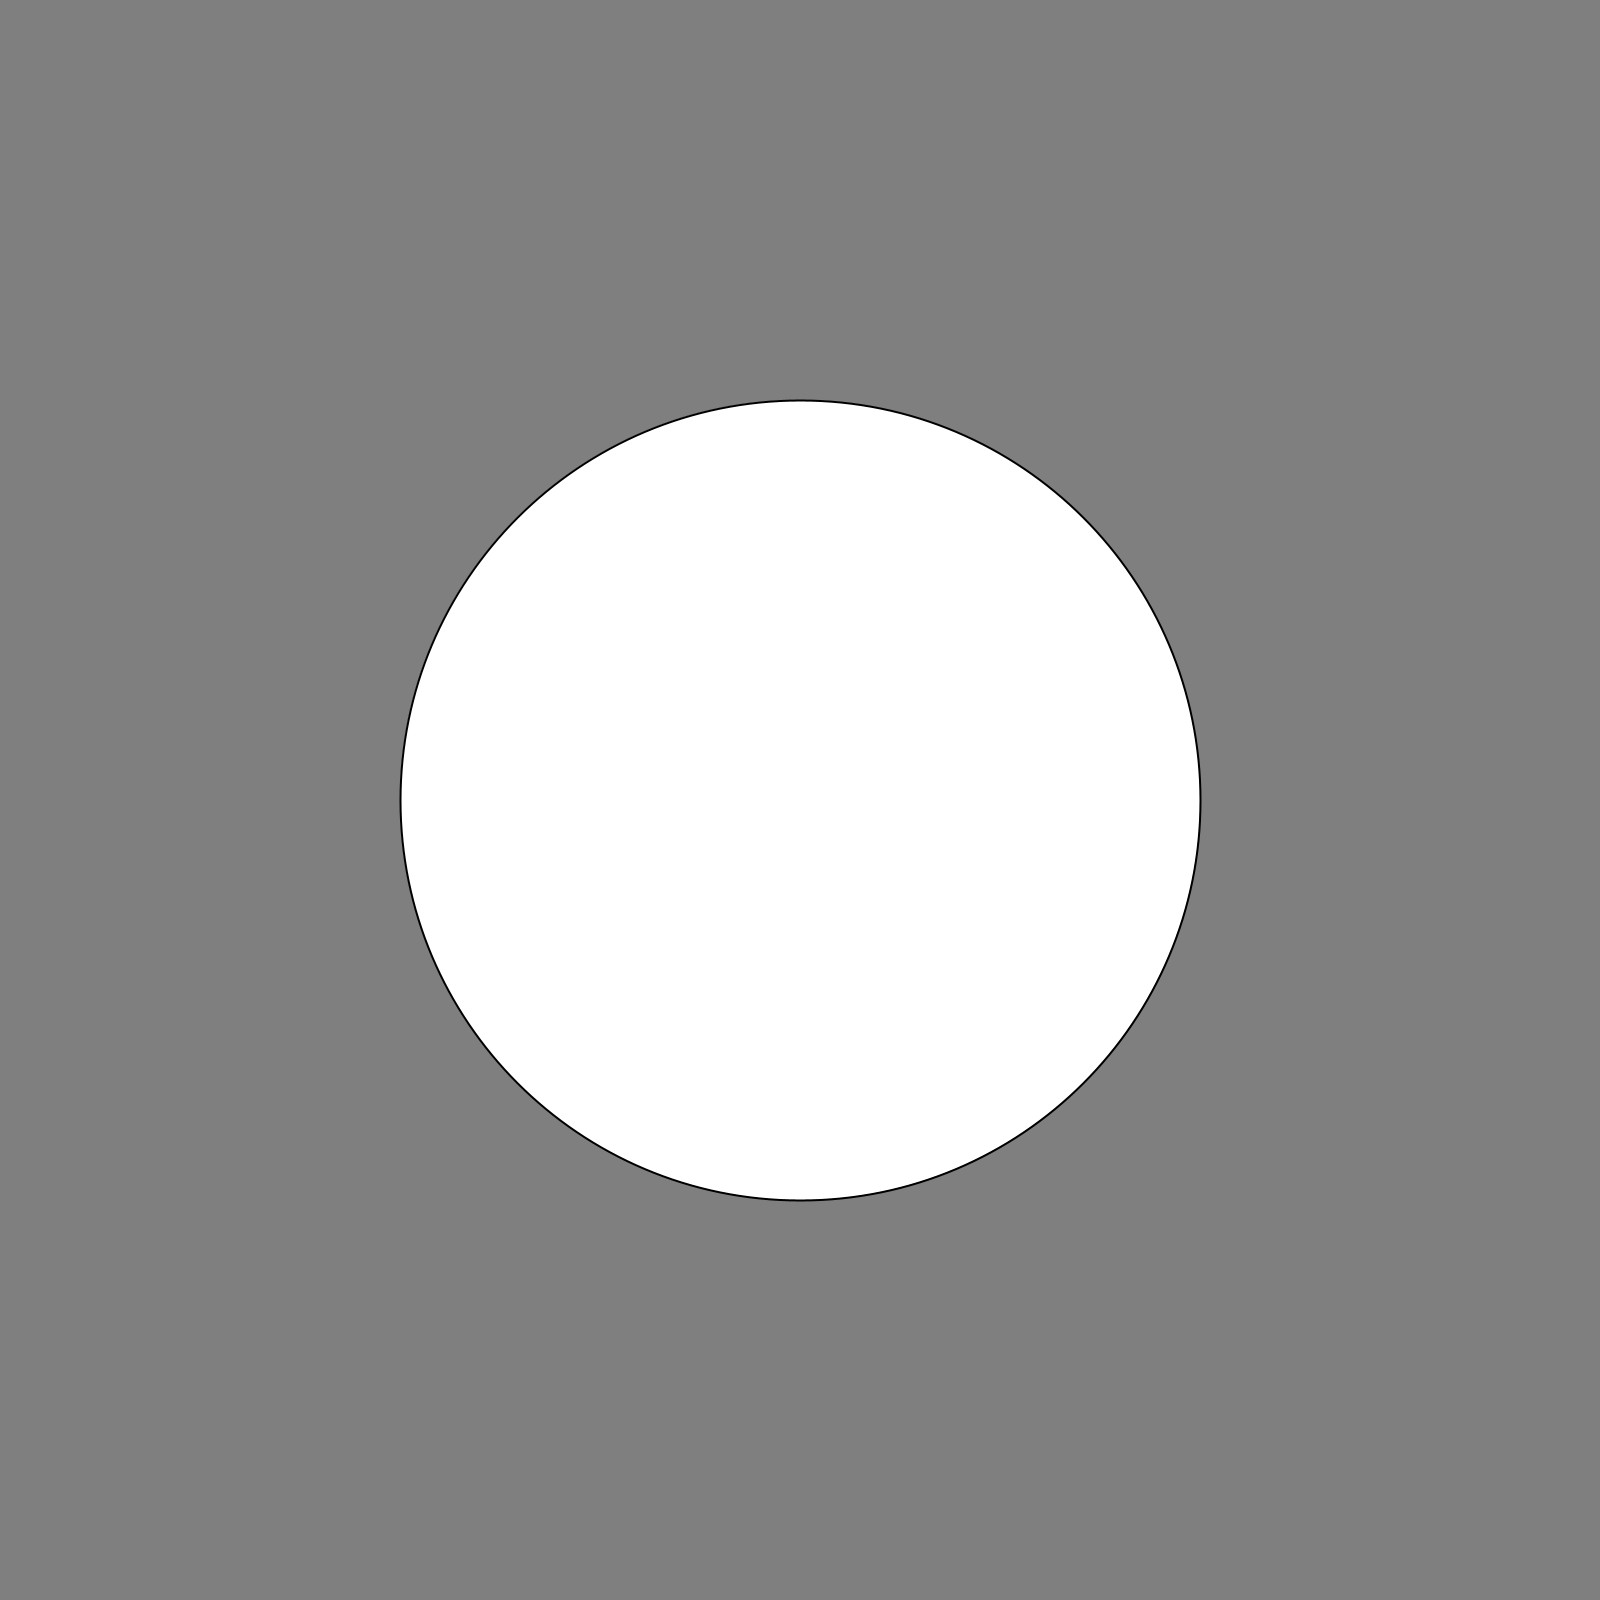
Drawing Order
The order that we write our code is important! p5.js "reads" our code from the top to bottom, just like we do. Each shape is drawn on top of the previous shape.
Examples:
Larger circle hides smaller circle:
function setup(){
    createCanvas(400,400);
}

function draw(){
    background(127);
    circle(200,200,100);
    circle(200,200,200);
}
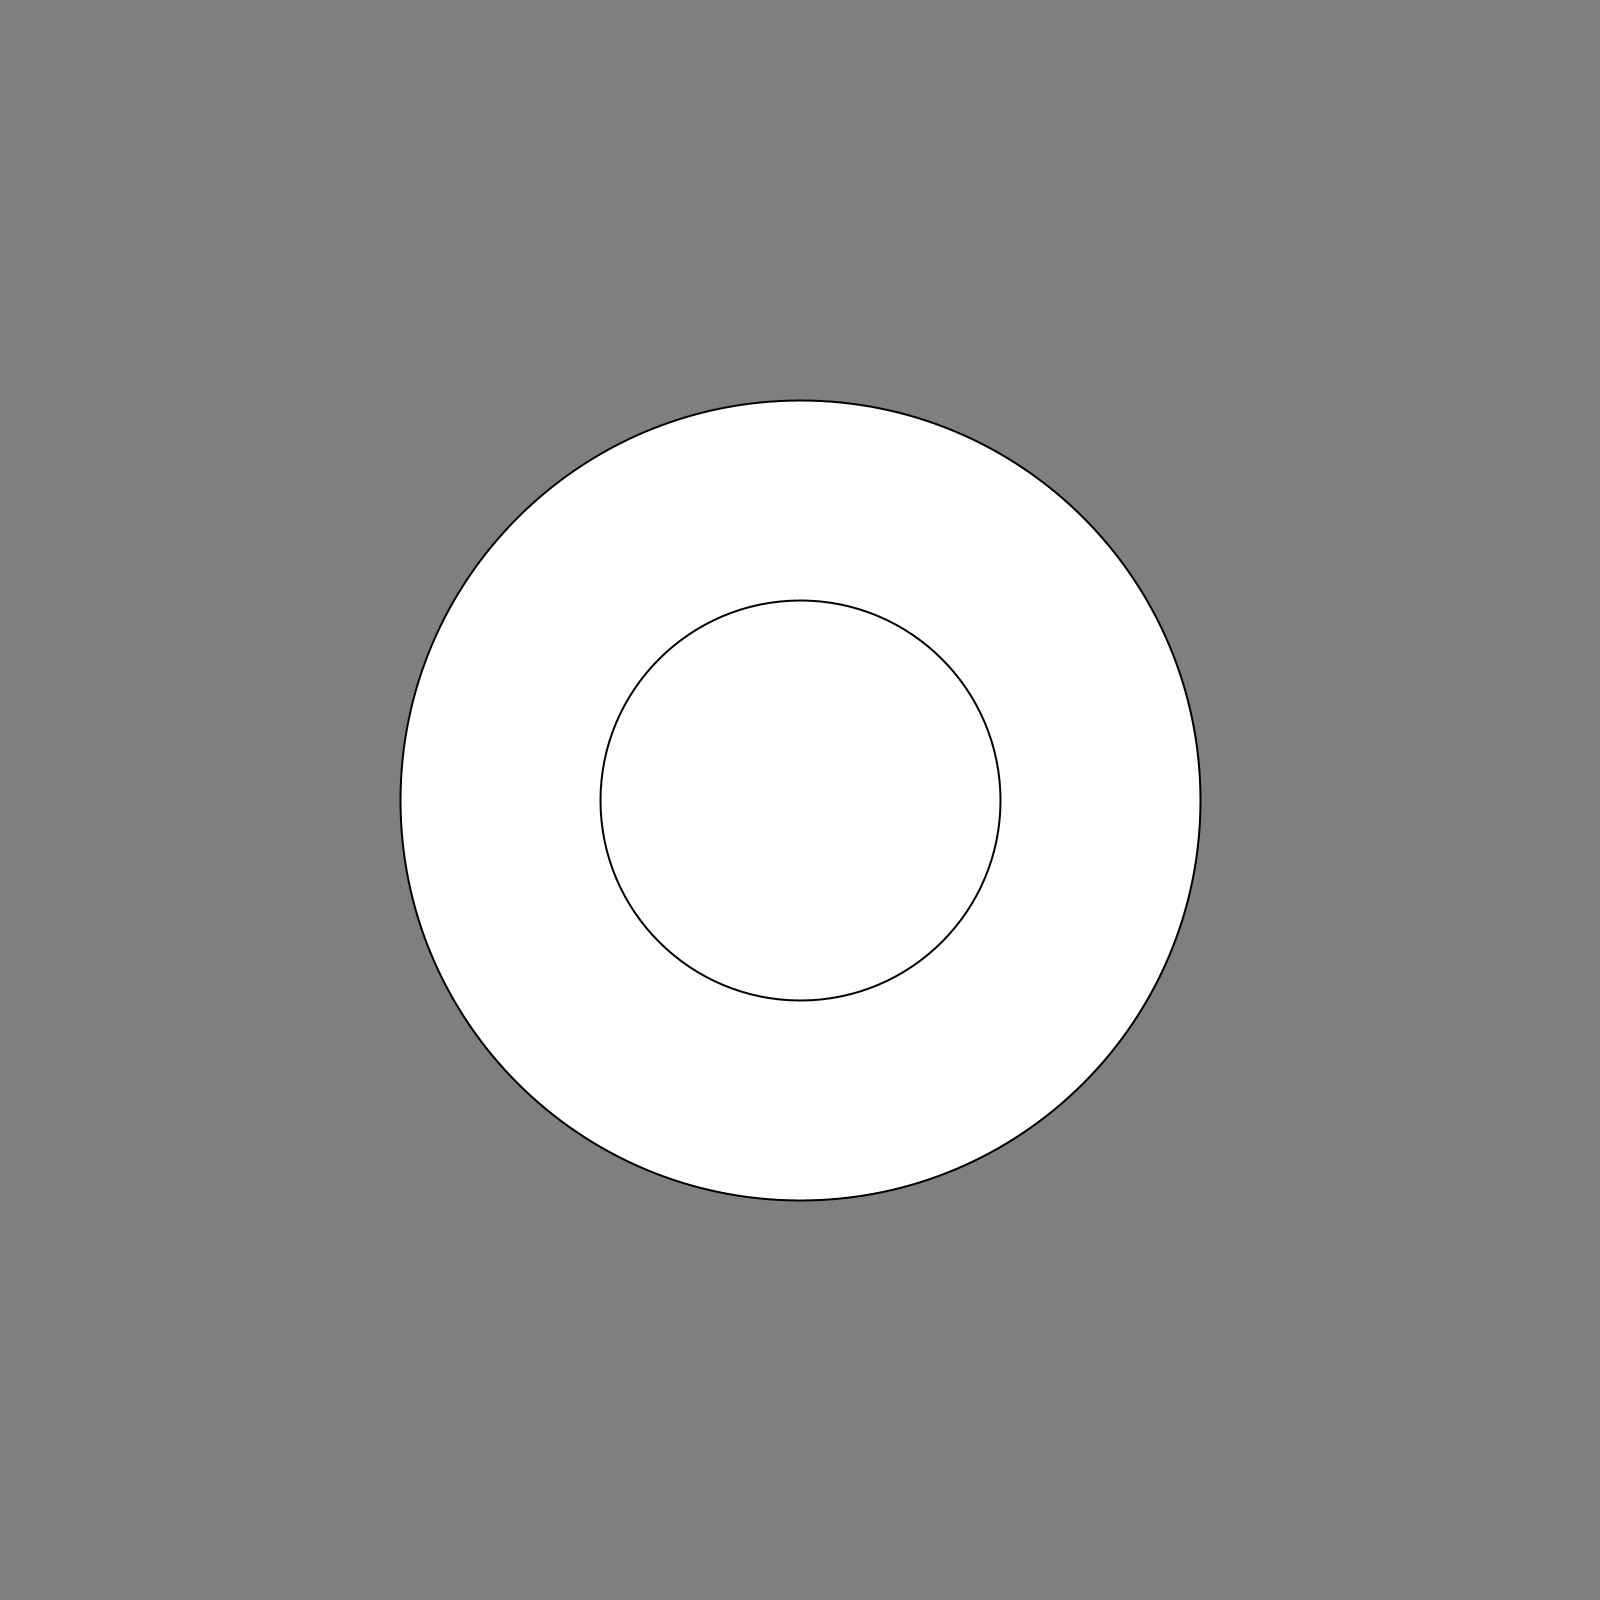
Smaller circle on top of larger circle:
function setup(){
    createCanvas(400,400);
}

function draw(){
    background(127);
    circle(200,200,200);
    circle(200,200,100);
}
Settings and Attributes
rectMode()noStroke()noFill()
rectMode()
We can modify how rectangles are drawn by using the function rectMode().
rectMode() can take in a few parameters, but we will focus on CENTER and CORNER
rectMode(CORNER) is the default behavior with our rectangles being drawn from the upper left corner.
rectMode(CENTER) will draw our rectangles from their center position
Example:
function setup() {
  createCanvas(400, 400);
}

function draw() {
  background(220);
  rectMode(CENTER);
  square(200, 200, 100);
  rectMode(CORNER);
  square(200, 200, 100);
}
noStroke()
noStroke() is a settings function that disables points, lines and outlines.
Example:
Note: because draw loops continuously noStroke() effects all shapes. The effect could be interrupted with a fill() (see below).
function setup() {
  createCanvas(400, 400);
}

function draw() {
  background(220);
  rectMode(CENTER);
  square(200, 200, 100);
  noStroke();
  rectMode(CORNER);
  square(200, 200, 100);
}

noFill()
noFill() disables fill for shapes.
Example:
function setup() {
  createCanvas(400, 400);
}

function draw() {
  background(220);
  noFill();
  circle(200, 200, 150);
  circle(100, 200, 150);
  circle(300, 200, 150);
}
Color
Colors in p5.js are Red, Blue, Green or RGB colors by default.
RGB and Alpha values have a range of 0-255, with 255 being full brightness.
Some functions that take color parameters:
background()- fills the canvas with color Referencefill()- changes the fill color of shapes Referencestroke()- changes the fill color of dots, lines and outlinesstroke()Reference
Each of these function can take a different numbers of parameters for different results:
fill(g)- gray scale valuefill(r,g,b)- red, blue and green valuesfill(r, g, b, a)- red, blue green and alpha (or opacity) values
Examples:
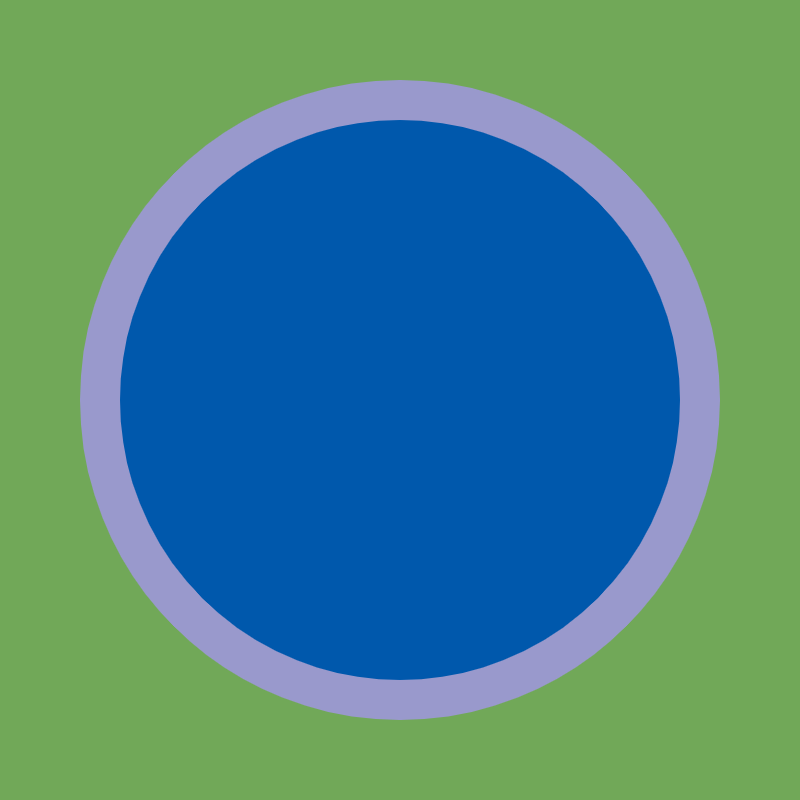
RGB values:
function setup() {
  createCanvas(400, 400);
}
function draw() {
  background(113, 168, 88);
  strokeWeight(20);
  stroke(153, 153, 204)
  fill(0, 88, 172);
  circle(200, 200, 300);
}
In this sketch, notice the addition of strokeWeight(), which changes the thickness of dots, lines and outlines.
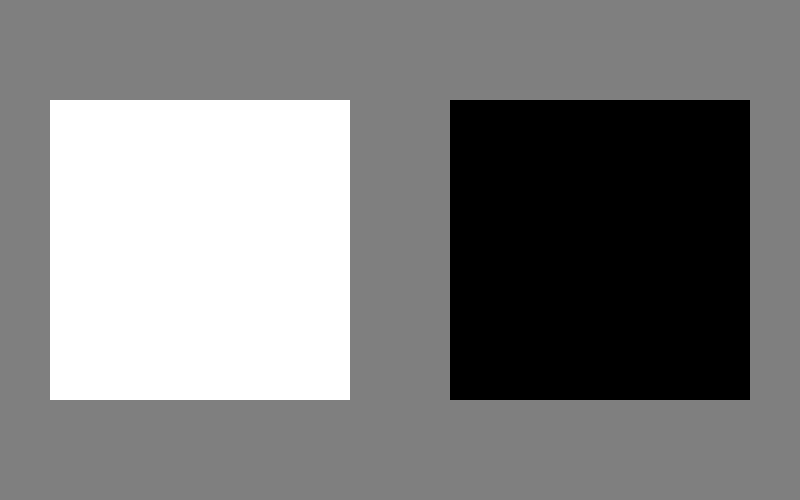
Gray values:
function setup() {
  createCanvas(400, 250);
}
function draw() {
  background(127);
  rectMode(CENTER);
  noStroke();
  fill(255);
  square(100, 125, 150);
  fill(0);
  square(300, 125, 150);
}
Alpha:
function setup() {
  createCanvas(400, 200);
}
function draw() {
  background(153, 153, 204);
  noStroke();
  fill(255, 207, 119, 255);
  circle(50, 100, 100);
  fill(255, 207, 119, 192);
  circle(150, 100, 100);
  fill(255, 207, 119, 127);
  circle(250, 100, 100);
  fill(255, 207, 119, 63);
  circle(350, 100, 100);
}

Saving an Image of you sketch
To save an image of your sketch, you can right click on your canvas and click on Save image as...
Sharing your Sketch
To share your sketch from p5.js:
- Make sure you are logged in and your sketch is saved.
- Navigate to File -> Share
- You can copy your Fullscreen or Edit link to share with others! (We'll discuss Embed later).